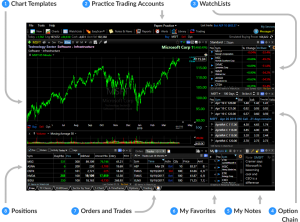
Key Indicators and Their Significance

Understanding key market indicators is crucial for navigating the complexities of stock market trading. These indicators provide valuable insights into price movements, investor sentiment, and overall market health, enabling informed decision-making. By analyzing these indicators in conjunction, traders can develop a more comprehensive understanding of the market’s current state and potential future trends.
Volume, Price, and Bid/Ask Spread
Volume, price, and the bid/ask spread are fundamental elements in analyzing market activity. Price represents the current market value of a security. High volume accompanying a price increase suggests strong buying pressure, while high volume with a price decrease indicates significant selling pressure. The bid-ask spread, the difference between the highest price a buyer is willing to pay (bid) and the lowest price a seller is willing to accept (ask), reflects liquidity.
A narrow spread suggests high liquidity (easy to buy or sell), while a wide spread indicates low liquidity (potentially difficult to execute trades quickly). For example, a stock with a consistently narrow bid-ask spread and increasing volume during an upward price trend is generally viewed as a positive signal.
Moving Averages
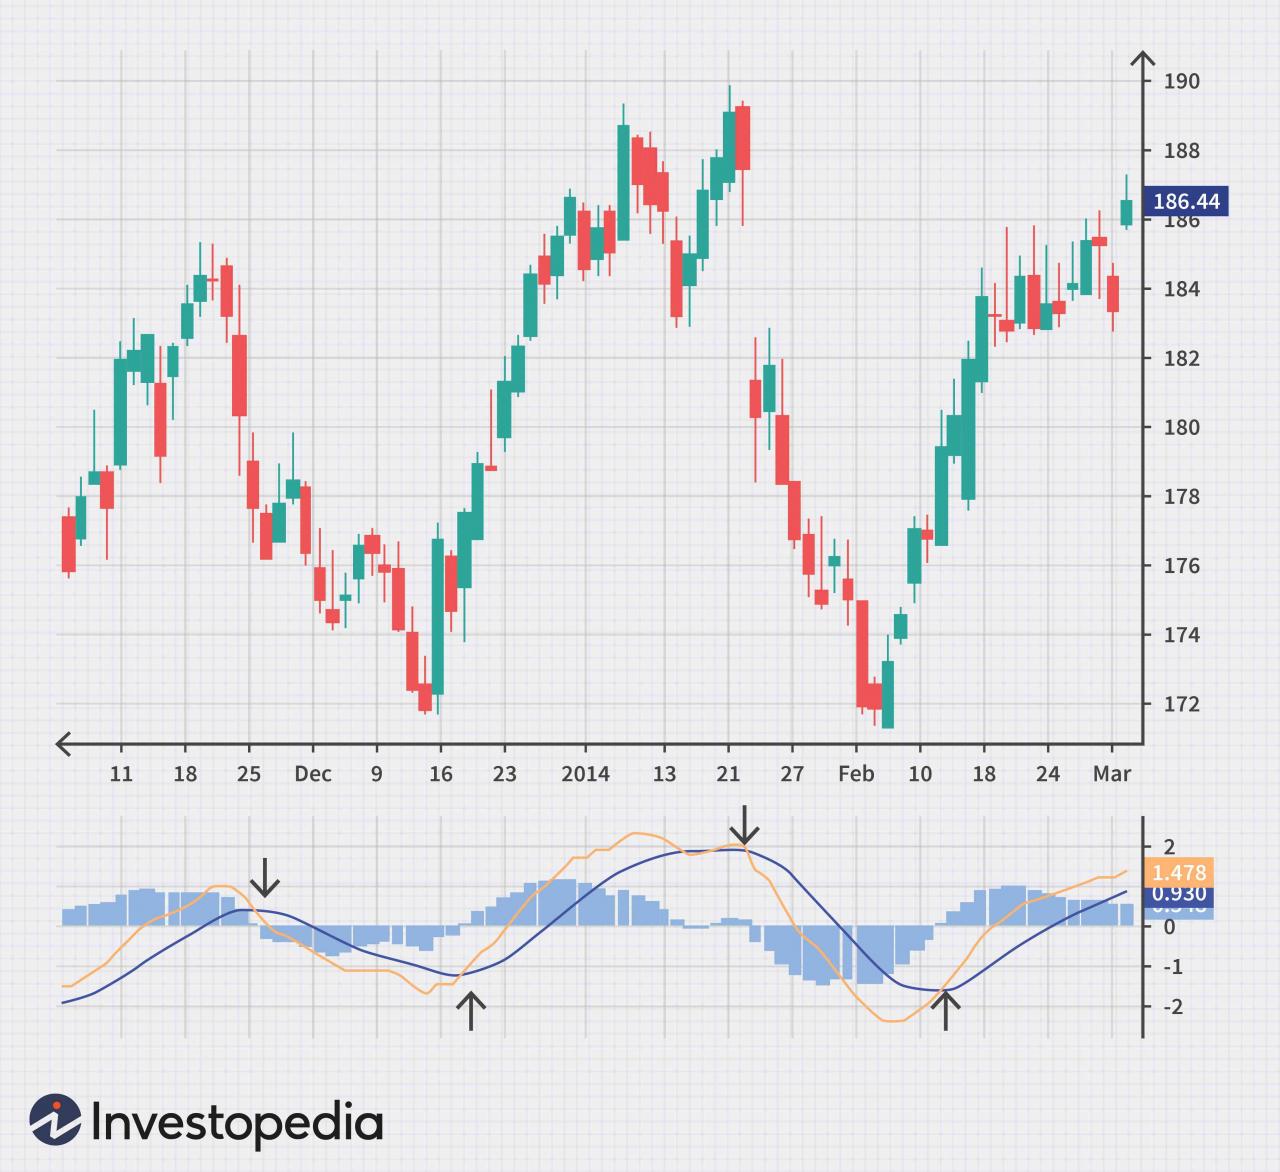
Moving averages are valuable tools in technical analysis, smoothing out price fluctuations to identify trends. A 50-day moving average represents the average closing price over the past 50 trading days, while a 200-day moving average reflects the average closing price over the past 200 trading days. A common strategy involves monitoring the relationship between these two averages: a “golden cross” occurs when the 50-day MA crosses above the 200-day MA, often considered a bullish signal, suggesting a potential upward trend.
Conversely, a “death cross,” where the 50-day MA crosses below the 200-day MA, is often seen as a bearish signal, potentially indicating a downward trend. These signals, however, should not be interpreted in isolation and should be considered alongside other indicators. For instance, the 200-day moving average has historically served as a significant support or resistance level for many stocks.
Market Sentiment Indicators
Three significant indicators that reveal market sentiment are the VIX (Volatility Index), the put/call ratio, and the advance-decline ratio. The VIX, often called the “fear gauge,” measures market volatility. Higher VIX values generally indicate increased fear and uncertainty among investors, while lower values suggest more confidence. The put/call ratio compares the volume of put options (bets on price declines) to call options (bets on price increases).
A high put/call ratio suggests bearish sentiment, while a low ratio indicates bullish sentiment. The advance-decline ratio compares the number of stocks that increased in price to the number that decreased. A high ratio indicates broad market strength, while a low ratio suggests weakness.
Using Indicators Together for a Comprehensive Market View
To gain a comprehensive market view, it’s essential to analyze these indicators together, rather than in isolation.
- Confirmation: Look for confirmation among indicators. For example, a golden cross (bullish) should ideally coincide with a decreasing VIX and a low put/call ratio, strengthening the bullish signal.
- Divergence: Identify potential divergences. If price is making new highs, but the VIX is also rising, it could suggest a weakening uptrend and potential for a reversal.
- Context: Consider the broader economic and geopolitical context. Positive economic news may offset bearish signals from some indicators.
- Risk Management: Use indicators to inform risk management strategies. High VIX values, for example, might warrant a more cautious approach.
Risk Management and Responsible Trading
Navigating the dynamic world of stock market trading requires a robust understanding of risk management. Ignoring risk can lead to significant financial losses, even with the most accurate live indicators. Successful traders prioritize risk mitigation strategies alongside their market analysis, ensuring their trading activities align with their risk tolerance and financial goals.Successful trading hinges on a disciplined approach to risk management, encompassing several key elements.
These elements work in concert to protect capital and maximize potential returns. A proactive, well-defined strategy is crucial to navigating the volatility inherent in the market.
Stop-Loss Orders: A Crucial Risk Management Tool
Stop-loss orders are invaluable tools for limiting potential losses. They automatically sell a security when it reaches a predetermined price, thus preventing further losses if the market moves against your position. For example, if you buy a stock at $50 and set a stop-loss order at $45, your shares will be sold automatically once the price drops to $45, regardless of market fluctuations.
This prevents significant losses in case of a sudden downturn. The specific stop-loss price should be determined based on your risk tolerance and the volatility of the asset. Setting stop-losses too tightly can lead to premature exits from profitable positions, while setting them too loosely can negate their protective function.
Position Sizing: Optimizing Portfolio Management
Position sizing refers to the percentage of your overall portfolio allocated to any single trade. It’s a critical aspect of risk management because it dictates the potential impact of any single losing trade on your entire portfolio. A well-defined position sizing strategy limits the potential damage from a losing trade, preventing significant drawdowns. For instance, a prudent strategy might limit individual trades to no more than 2-5% of your total capital.
This ensures that even a significant loss on a single trade will not cripple your entire portfolio. This approach encourages a more measured and less emotionally driven approach to trading.
Strategies for Avoiding Emotional Decision-Making
Emotional trading, driven by fear and greed, is a significant obstacle to consistent profitability. To mitigate this, traders should establish a structured trading plan that clearly Artikels entry and exit strategies, risk tolerance, and position sizing. Sticking to the plan, regardless of market sentiment, helps eliminate impulsive decisions. Furthermore, maintaining a trading journal documenting trades, rationale, and outcomes can provide valuable insights into emotional biases and areas for improvement.
Regularly reviewing this journal can help identify patterns of emotional decision-making and refine trading strategies accordingly.
Best Practices for Responsible Trading Using Real-Time Market Data
Responsible trading requires a multifaceted approach. Here are some key best practices:
- Thorough research and due diligence before entering any trade.
- Diversification of your portfolio across different asset classes to reduce overall risk.
- Regular review and adjustment of your trading plan based on market conditions and performance.
- Continuous learning and improvement through education and experience.
- Maintaining accurate records of all trades and transactions for tax and portfolio management purposes.
- Seeking professional financial advice when needed.