Data Sources and Reliability

Live stock market analysis tools rely on a continuous stream of data to provide accurate and timely insights. The reliability of these tools is directly tied to the quality and timeliness of their data sources. Understanding these sources and the potential for inaccuracies is crucial for any serious investor.The primary data sources for live stock market tools include exchanges themselves (like the New York Stock Exchange or NASDAQ), financial data providers (such as Refinitiv, Bloomberg, and FactSet), and regulatory bodies (like the SEC).
These sources provide raw data on trades, quotes, and company financials, which are then processed and presented by the analysis tools. However, this process isn’t always perfect.
Data Inaccuracies and Delays
Data inaccuracies and delays are inherent risks in live market data feeds. Inaccuracies can stem from errors in data entry, transmission problems, or even deliberate manipulation (though this is less common and heavily regulated). Delays can arise from network latency, processing bottlenecks, or simply the time it takes for transactions to be fully recorded and disseminated. These inaccuracies and delays can lead to missed trading opportunities or, worse, incorrect investment decisions.
For example, a delayed price update might cause a trader to miss a significant price drop or surge, resulting in substantial financial losses. Similarly, inaccurate data on a company’s financial performance could lead to misjudgments about its future prospects.
Strategies for Verifying Data Reliability
Several strategies can be employed to verify the reliability of information presented by different live stock market tools. First, compare data from multiple sources. If several independent tools display consistent data, it increases confidence in its accuracy. Second, cross-reference data with official exchange announcements and regulatory filings. This is particularly important for significant events like earnings reports or corporate actions.
Third, be aware of the tool’s stated latency and accuracy metrics. Reputable providers will openly disclose their data refresh rates and error tolerances. Finally, consider using tools that offer data provenance tracking, which allows you to trace the origin and processing of the data, thereby improving transparency and accountability.
Comparison of Data Providers
The following table compares three popular live stock market data providers based on perceived accuracy and speed. Note that these are subjective assessments based on general market perception and may vary depending on specific data points and geographical location. Real-world performance can also fluctuate.
| Data Provider | Data Accuracy | Data Speed (Latency) |
|---|---|---|
| Refinitiv | High | Low (typically under 1 second) |
| Bloomberg | High | Low (typically under 1 second) |
| FactSet | High | Low (typically under 1 second) |
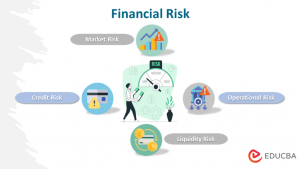
Risk Management and Tools
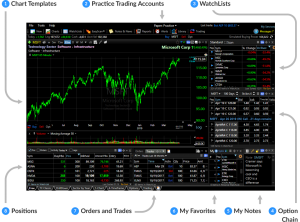
Live stock market analysis tools play a crucial role in mitigating investment risk. They provide real-time data, advanced charting capabilities, and automated functionalities that empower investors to make informed decisions and protect their capital. Effective utilization of these tools is key to successful and less stressful trading.By leveraging the features offered by these tools, investors can significantly reduce their exposure to unpredictable market fluctuations and enhance their overall trading strategy.
The following sections will detail how these tools facilitate risk management.
Stop-Loss Orders and Position Sizing
Live stock market analysis tools greatly simplify the process of setting and managing stop-loss orders. These tools typically offer features allowing users to input specific price thresholds at which their positions will be automatically sold, limiting potential losses. Furthermore, many platforms provide sophisticated position sizing calculators. These calculators help determine the appropriate amount of capital to allocate to each trade based on factors such as risk tolerance, account size, and the volatility of the underlying asset.
For example, a tool might suggest allocating no more than 2% of your total capital to a single high-volatility trade. This prevents a single losing trade from significantly impacting the overall portfolio.
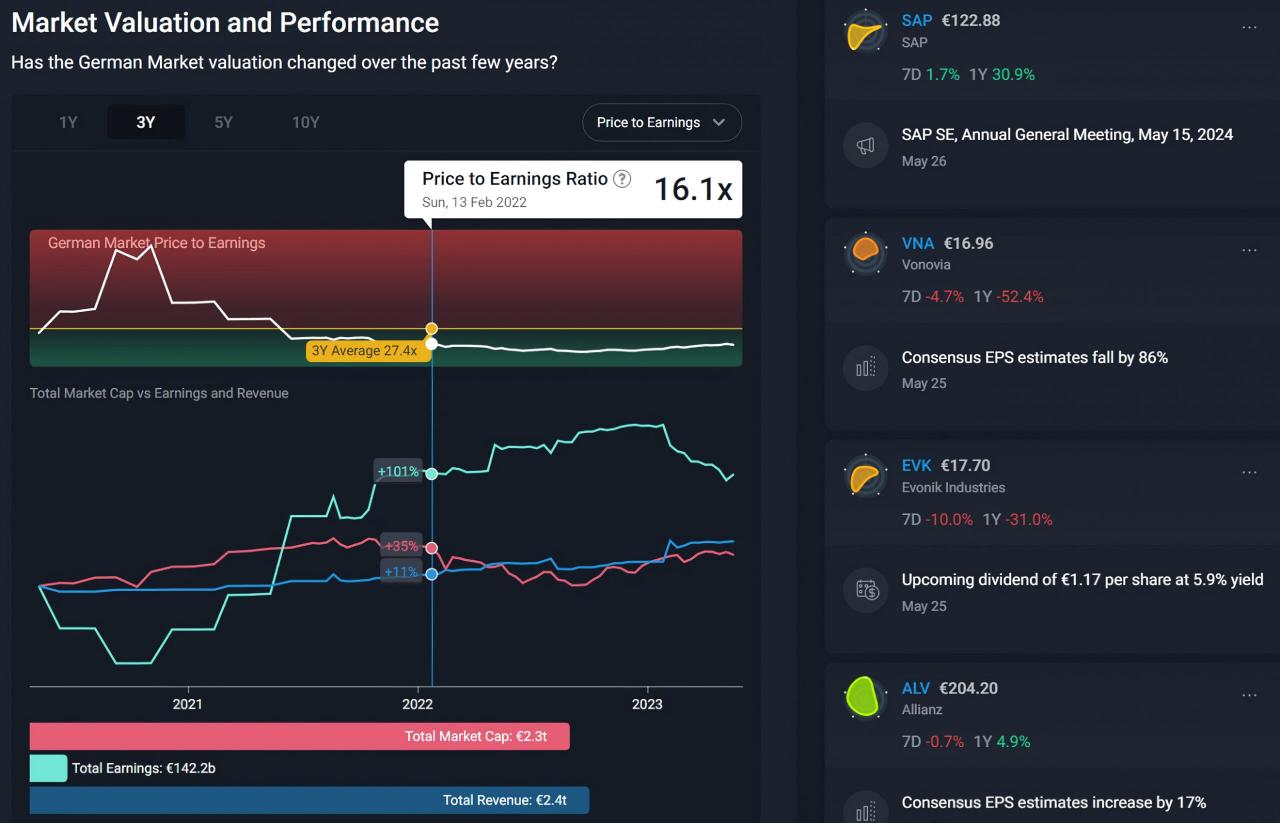
Portfolio Performance and Risk Exposure Monitoring
These tools often include dashboards providing a comprehensive overview of portfolio performance, including key metrics such as total return, Sharpe ratio, and maximum drawdown. Real-time monitoring of these metrics allows investors to quickly identify potential issues and adjust their strategies accordingly. Furthermore, advanced tools can provide risk exposure reports, detailing the concentration of investments across different asset classes and sectors.
This allows investors to identify and mitigate potential overexposure to specific risks. For instance, an investor might realize their portfolio is heavily weighted in technology stocks and decide to diversify by adding exposure to other sectors like healthcare or consumer staples.
Step-by-Step Guide to Mitigating Investment Risk
Effective risk management requires a proactive approach. Here’s a step-by-step guide on using live stock market tools to minimize investment risk:
- Define your risk tolerance: Before engaging in any trading activity, clearly define your risk tolerance. Are you a conservative, moderate, or aggressive investor? This will guide your position sizing and stop-loss order placement.
- Set stop-loss orders: Use your live stock market analysis tool to set stop-loss orders for each trade. This automatically limits potential losses should the market move against your position.
- Employ position sizing techniques: Utilize position sizing calculators integrated within your trading platform to determine the appropriate allocation of capital to each trade, preventing significant losses from a single trade.
- Diversify your portfolio: Use the portfolio analysis features to assess your current asset allocation. Diversify your investments across different asset classes and sectors to reduce overall risk. Tools can help visualize this diversification, showing the weighting of each asset.
- Monitor portfolio performance regularly: Regularly review your portfolio’s performance using the dashboard provided by your trading platform. Track key metrics such as total return, maximum drawdown, and Sharpe ratio to identify potential issues early on.
- Adjust your strategy as needed: Based on your monitoring, adjust your trading strategy accordingly. This might involve adjusting stop-loss orders, rebalancing your portfolio, or exiting certain positions.